
The Fixed Mill Levy Issue: Why Montana’s 95 Mill Levy is Unsustainable in the Long Run Part 3 (Series on Property Taxation in Montana)
October 16, 2024
By Greg Gilpin
The 2023 property tax cycle created widespread concern among policymakers, businesses,
and especially homeowners as many experienced steep increases in their property taxes. Accusations flew, with Governor Gianforte pointing to the few local governments' excessive spending as the cause, while local policymakers argued that the 95-Mill Levy was the culprit. Others suggested that large corporations were responsible.
Regardless of who is right, the dramatic rise in market values from the 2023 reassessment highlights a major flaw
in Montana’s property tax system that relies extensively on fixed mill levies. The system is unsustainable over time and requires continual correction.
In this post, I examine the impact of the State’s use of fixed mill levies, specifically
the 95-Mill Levy for public school equalization, the 6-Mill Levy for universities,
and the 1.5-Mill Levy for vocational colleges.a
Why Fixed Mill Levies Are Problematic?
As discussed in Part 2 of this series, an increase in property values does not automatically
lead to higher property taxes—unless the property tax system includes fixed mill levies.
When mill levies are fixed, rising property values result in a permanent increase
in taxes, and a larger portion is paid to that government entity with the fixed levies.
Let's examine this principle using an example residential property in Bozeman, which saw a substantial increase in market value
following the 2023 Department of Revenue reassessment. Bozeman is often criticized
for high local government spending, making it a relevant case for this discussion.
Changes in the Share of Taxes Paid
Table 1 shows the shares of property taxes paid to local governments and the State
in 2022 and 2023 using the mill levies provided on the tax statements. The table reveals
an increase in the share of taxes paid to the State over time.
| Table 1: Share of Property Taxes Paid | |||
| 2022 | 2023 | Change | |
| Local Governments | |||
| City of Bozeman | 32.90% | 30.60% | -2.40% |
| Gallatin County | 14.70% | 15.10% | 0.40% |
| Schools | 35.90% | 33.60% | -2.30% |
| Local Taxes Paid | 83.50% | 79.20% | -4.30% |
| State of Montana | |||
| School Equalization (95 mills) | 15.30% | 19.30% | 4.00% |
| Higher Education (7.5 mills) | 1.20% | 1.50% | 0.30% |
| State Taxes Paid | 16.50% | 20.80% | 4.30% |
Note: Actual taxes paid for a residential property in Bozeman, MT in 2022 and 2023.
Key Insights
- The share of taxes paid to local governments fell by 4.3 percentage points.
- The share of taxes paid to the State increased by 4.3 percentage points.
- These proportions are applicable for all properties within this taxing jurisdiction, i.e., they are independent of this property’s value.
This demonstrates that as property values rise, the proportion of taxes allocated
to the State (which applies fixed mill levies) increases, while the share allocated
to local governments (which apply floating levies) decreases. This reallocation will
occur statewide in Montana whenever property values increase.
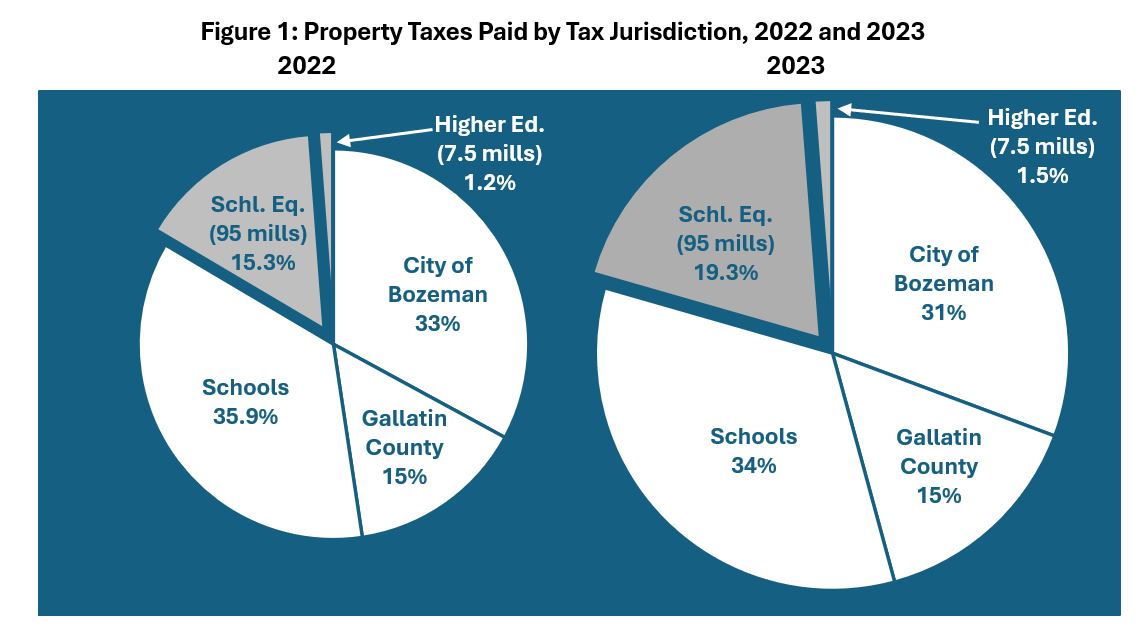
Pie Chart Comparison
To illustrate the dynamic reallocation of property taxes to the State, let’s graph
Table 1 using two pie charts, one for 2022 and another for 2023, where the area of
a pie represents the taxes paid in each year, and individual slices represent the
amount and portion of taxes paid to each tax jurisdiction. The white slices represent taxes paid to local governments, and the gray slices represent the taxes paid to the State.
In Figure 1, the area of the first pie equals $3,867 and the area of the second pie equals $5,215, reflecting taxes paid in each year. Focusing on the slices, the City of Bozeman received 32.9% of the taxes in 2022 and 30.6% in 2023. Although Bozeman’s percentage share decreased, the actual amount of taxes collected
increased by $325, from $1,279 to $1,605. Similarly, the State of Montana received 16.5% of the taxes in 2022 and 20.8% in 2023.c
 Note: Actual taxes paid for a residential property in Bozeman, MT in 2022 and 2023. Special assessments, which remained unchanged between
years are excluded as they represent 0.02% of the total taxes. The size represents
the total amount of taxes paid, while the slices represent the amount and share of
taxes each tax jurisdiction is paid.
Note: Actual taxes paid for a residential property in Bozeman, MT in 2022 and 2023. Special assessments, which remained unchanged between
years are excluded as they represent 0.02% of the total taxes. The size represents
the total amount of taxes paid, while the slices represent the amount and share of
taxes each tax jurisdiction is paid.
Key Insights
- The share of tax revenue paid to the State rose from 16.5% to 20.8%, a 4.3 percentage point increase.
- The share of tax revenue paid to local governments fell from 83.5% to 79.2%, a 4.3 percentage point decrease.
- As taxable values increase, the property tax system reallocates 4.3 percentage points of tax revenue from local governments to the State.
How Does This Reallocation of Tax Revenue from Local Governments to the State Occur?
The reallocation of tax revenue from local governments to the State occurs because
these jurisdictions use different types of mill levies. The State applies fixed mill
levies that increase tax revenue as property values rise, while local governments
primarily use floating mill levies that adjust to maintain consistent revenue.
- State’s Fixed Mill Levies: As property values increase, so do the taxes paid to the State, directly boosting its share of tax revenue.
- Local Government’s Floating Mill Levies: Local governments cannot exceed state-imposed budget limits, so their mill rates fall as property values rise, reducing their share of tax revenue.d
- State Revenue Growth: Fixed mill levies continually increase State tax revenue as property values grow.
- Local Revenue Growth: Local governments can only increase their revenue by raising their budgets through voter-approved levies.
Dick Barrett, a retired economist and former member of the Montana Legislature, offers a similar viewpoint on Montana’s 2023 property value reassessment cycle.
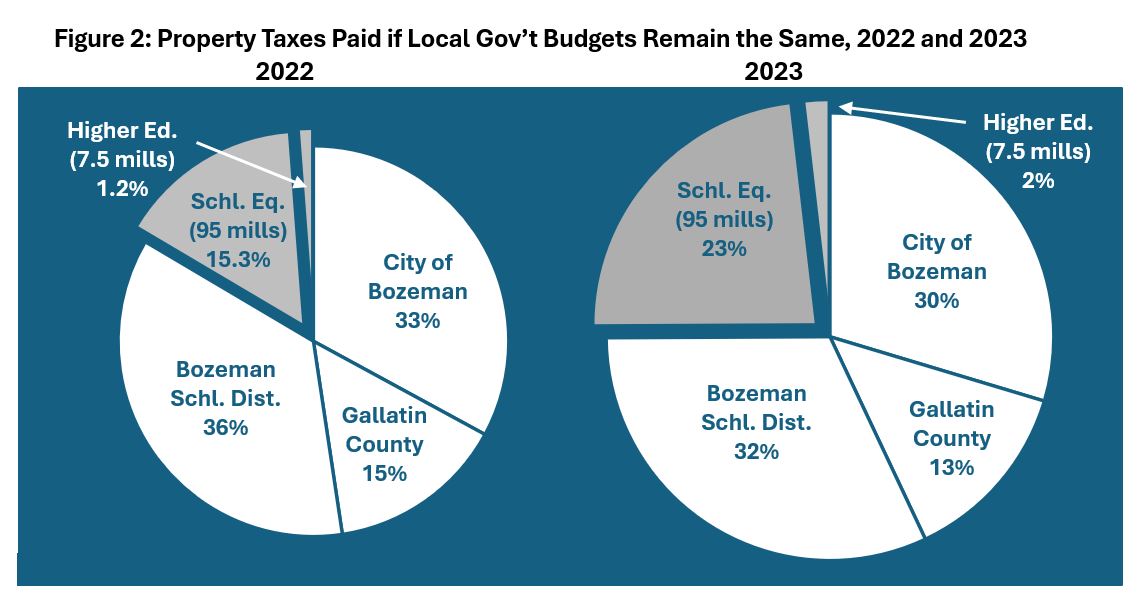
What Happens If Taxable Values Keep Increasing Over Time and Local Government Budgets Remain the Same?
As taxable values rise, property taxes increase due to the State's fixed mill levies,
leading to even larger increases in the amount and share of tax revenue allocated
to the State. In contrast, local governments' tax revenue remains constant, and their
share experiences even larger decreases.
Figure 2 illustrates this with an example property. The first pie equals $3,867, while the
second pie equals $4,315, reflecting how local government budgets stayed flat. As
a result, the State’s share of tax revenue increases even more, while the local government’s
share decreases further.
Continual Corrections to Montana’s Property Tax System
Montana’s property tax system requires ongoing adjustments to address the excess tax
revenue collected by the State. There are two primary approaches to achieving this:
reducing taxable rates or reallocating local government expenditures to the State.
1. Reduce taxes paid to the State
Since the inception of the 95-mill levy, the Montana Legislature has implemented this approach by:
- Adjusting property tax rates for agricultural, commercial, and residential properties (see Table 2 below).
- Providing property value exemptions and reductions to specific properties through the use of 1,145 property class codes. These adjustments primarily benefit agricultural, commercial, and industrial properties by lowering their taxable values.
| Class | 2003 | 2004 | 2005 | 2006 | 2007 | 2008 | 2009 | 2010 | 2011 | 2012 | 2013 | 2014 | 2015 -23 |
| 1 | 100 | 100 | 100 | 100 | 100 | 100 | 100 | 100 | 100 | 100 | 100 | 100 | 100 |
| 2 | 3 | 3 | 3 | 3 | 3 | 3 | 3 | 3 | 3 | 3 | 3 | 3 | 3 |
| 3 | 3.40 | 3.30 | 3.22 | 3.14 | 3.07 | 3.01 | 2.93 | 2.82 | 2.72 | 2.63 | 2.54 | 2.47 | 2.16 |
| 4 Res | 2.35 | 2.26 | 2.19 | 2.12 | 2.05 | 1.99 | 1.85 | 1.71 | 1.58 | 1.47 | 1.38 | 1.31 | 1.35 |
| 4 Com | 2.96 | 2.86 | 2.78 | 2.69 | 2.62 | 2.56 | 2.51 | 2.37 | 2.24 | 2.13 | 2.02 | 1.94 | 1.89 |
| 5 | 3 | 3 | 3 | 3 | 3 | 3 | 3 | 3 | 3 | 3 | 3 | 3 | 3 |
| 6 | |||||||||||||
| 7 | 8 | 8 | 8 | 8 | 8 | 8 | 8 | 8 | 8 | 8 | 8 | 8 | 8 |
| 8 | 3 | 3 | 3 | 3 | 3 | 3 | 1 | 3 | 3 | 3 | 3 | 3 | 3 |
| 9 | 12 | 12 | 12 | 12 | 12 | 12 | 12 | 12 | 12 | 12 | 12 | 12 | 12 |
| 10 Forest | 0.35 | 0.35 | 0.35 | 0.35 | 0.35 | 0.35 | 0.34 | 0.33 | 0.32 | 0.31 | 0.30 | 0.29 | 0.37 |
| 11 | |||||||||||||
| 12 | 3.88 | 3.81 | 3.74 | 3.55 | 3.52 | 3.44 | 3.45 | 3.40 | 3.45 | 3.45 | 3.39 | 3.28 | 2.37 - 3.2 |
| 13 | 6 | 6 | 6 | 6 | 6 | 6 | 6 | 6 | 6 | 6 | 6 | 6 | 6 |
| 14 | 3 | 3 | 3 | 3 | 3 | 3 | 3 | 3 | 3 | 3 | 3 | ||
| 15 | 3 | 3 | 3 | 3 | 3 | 3 | 3 | 3 | 3 | ||||
| 16 | 2.25 | 2.25 | 2.25 | 2.25 | 2.25 | 2.25 | 2.25 | 2.25 | 2.25 | ||||
| 17 | 0.9 | ||||||||||||
| 18 | 3 |
Note: In 100%. Classes 17 and 18 were created in 2017 and 2022, respectively. Source:
DOR.
2. Reallocating local government expenditures to the State
The State could assume certain local government expenditures. An example of this is the SEPTR Account, which reallocates some public school retirement payments from local school districts to the State.
What Are Other States Doing?
Currently, nine states have statewide property taxes similar to the 95-mill Levy for
education. Of these states, six use a tax rate that adjusts to rising property values,
while three use fixed mill levies. Among those with fixed mill levies, Montana is
the only state without laws limiting either the growth of assessment values or tax
revenue.
| Table 3: Statewide Property Tax for Education | |||
| State | Law | Mills or Tax Rate (%) |
Adjustable Tax Rate |
| Kansas | SB 300 | 18 | Float |
| Kentucky | SEEK | <3 | Float |
| Michigan | SET Act | 6 | Fixed |
| Montana | MCA 20-9-331, 20-9-360, 20-9-333 | 95 | Fixed |
| New Hampshire | SWEPT | 1.13 | Float |
| Utah | HB 293 | 16 - 20 | Float |
| Vermont | ACT 183 | 1.50% | Float |
| Washington | ESSB 6614 | 2.4 | Float |
| Wyoming | W.S. 21-13-303 and 39-13-104(a)(iv)) | 12 | Fixed |
Source: "A 50-State Survey of School Finance Policies and Programs (2018)." Deborah Verstegen.
Thesis. University of Nevada, Reno.
Key Insights for Statewide Fixed Mill Levies for Education:
- Michigan uses a 6-mill levy with a 5% cap on assessment value growth for school-related taxes.
- Wyoming uses a 12-mill levy with a 4% cap on property tax increases.
- Montana uses a fixed mill levy without any caps on assessment value growth or property tax growth for state-level school-related taxes.
Conclusion
Fixed mill levies create an unsustainable tax system. As demonstrated, the amount
and proportion of taxes paid to the State increase significantly over time, even as
local governments face restrictions on raising their budgets. This creates a system where local governments’ share of tax revenue diminishes unless
they request additional levies from voters, while the State’s share grows unchecked.
Key Takeaways
- Fixed mill levies lead to higher taxes as property values increase, disproportionately benefiting the State.
- Local governments' share of tax revenue decreases as their floating mill levies adjust to maintain budgets.
- Policymakers must regularly adjust property tax policies to prevent the State from collecting excessive tax revenue.
Footnotes
a Every property in Montana is subject to the 95-Mill Levy for public school district equalization, which is divided into 33 mills for elementary schools, 40 mills for aid, and 22 mills for high schools.
b The percentage increase in market value and taxable value are equal because taxable
value is a fixed ratio of market value. See Part 1 of this Series for more details.
c This post studies the impact of the 95-Mill Levy without any other property tax policy
changes. In actuality, the Governor signed a property tax rebate for 2022 and 2023 of up to $675. When factoring in these rebates, the proportion
of property taxes paid to the state was -1.3% in 2022 and 9.0% in 2023. As a result,
very few homeowners saw an increase in property taxes directly attributable to the
95-, 6-, or 1.5-Mill Levies during 2022 or 2023.
d Only in areas where taxable values decrease would the exact opposite reallocation
between the State and local governments occur (currently nowhere in Montana).
This is Part 3 of a Series on Property Taxation in Montana.

Greg Gilpin
Professor