
Data
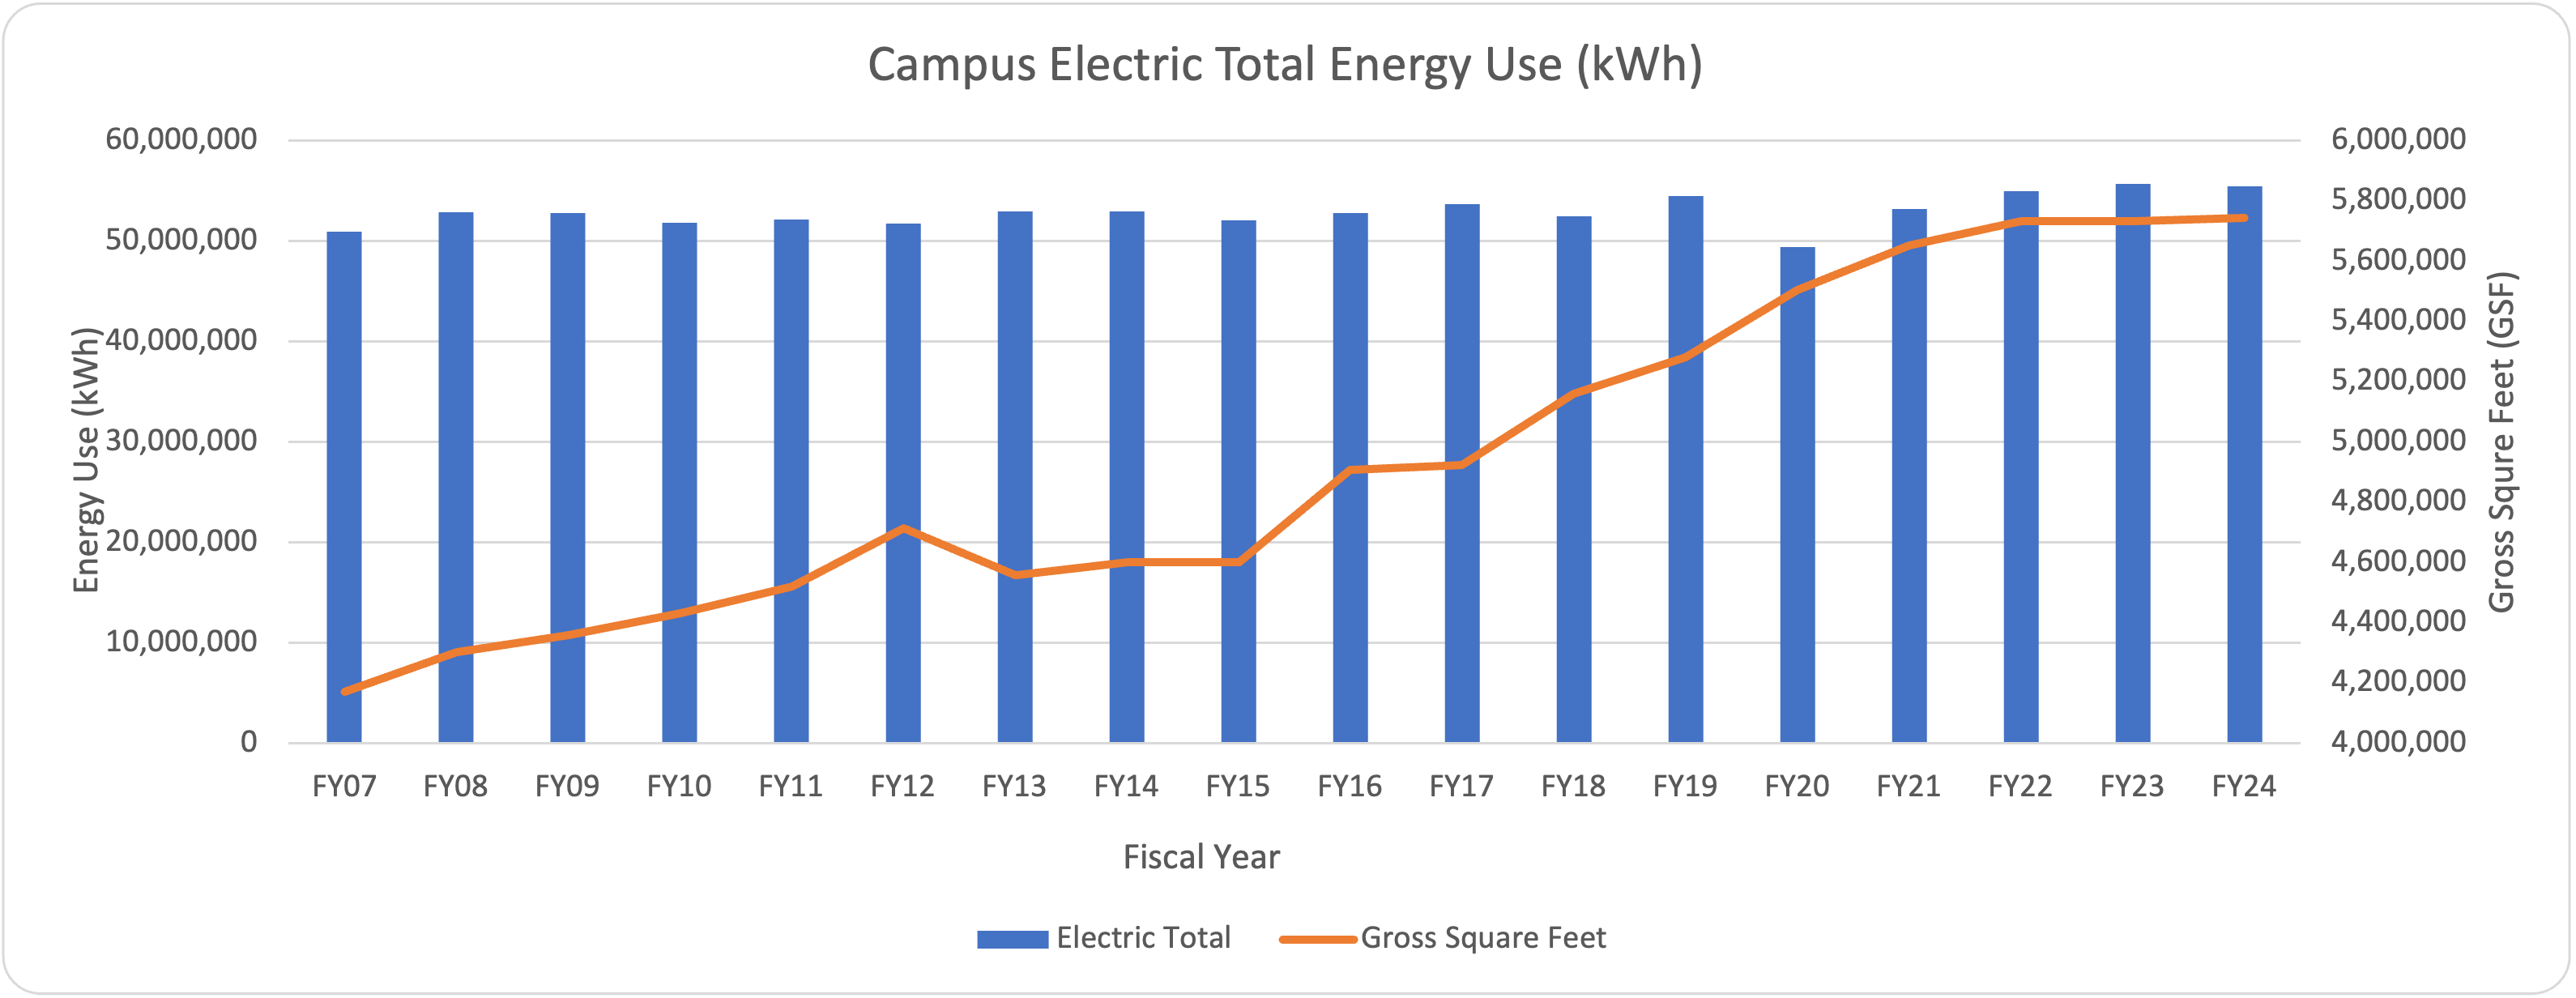
Campus electric use has increased 9% since FY07. Campus gross square feet has increased 38% over the same period. Electric use per gross square foot has decreased 21%.
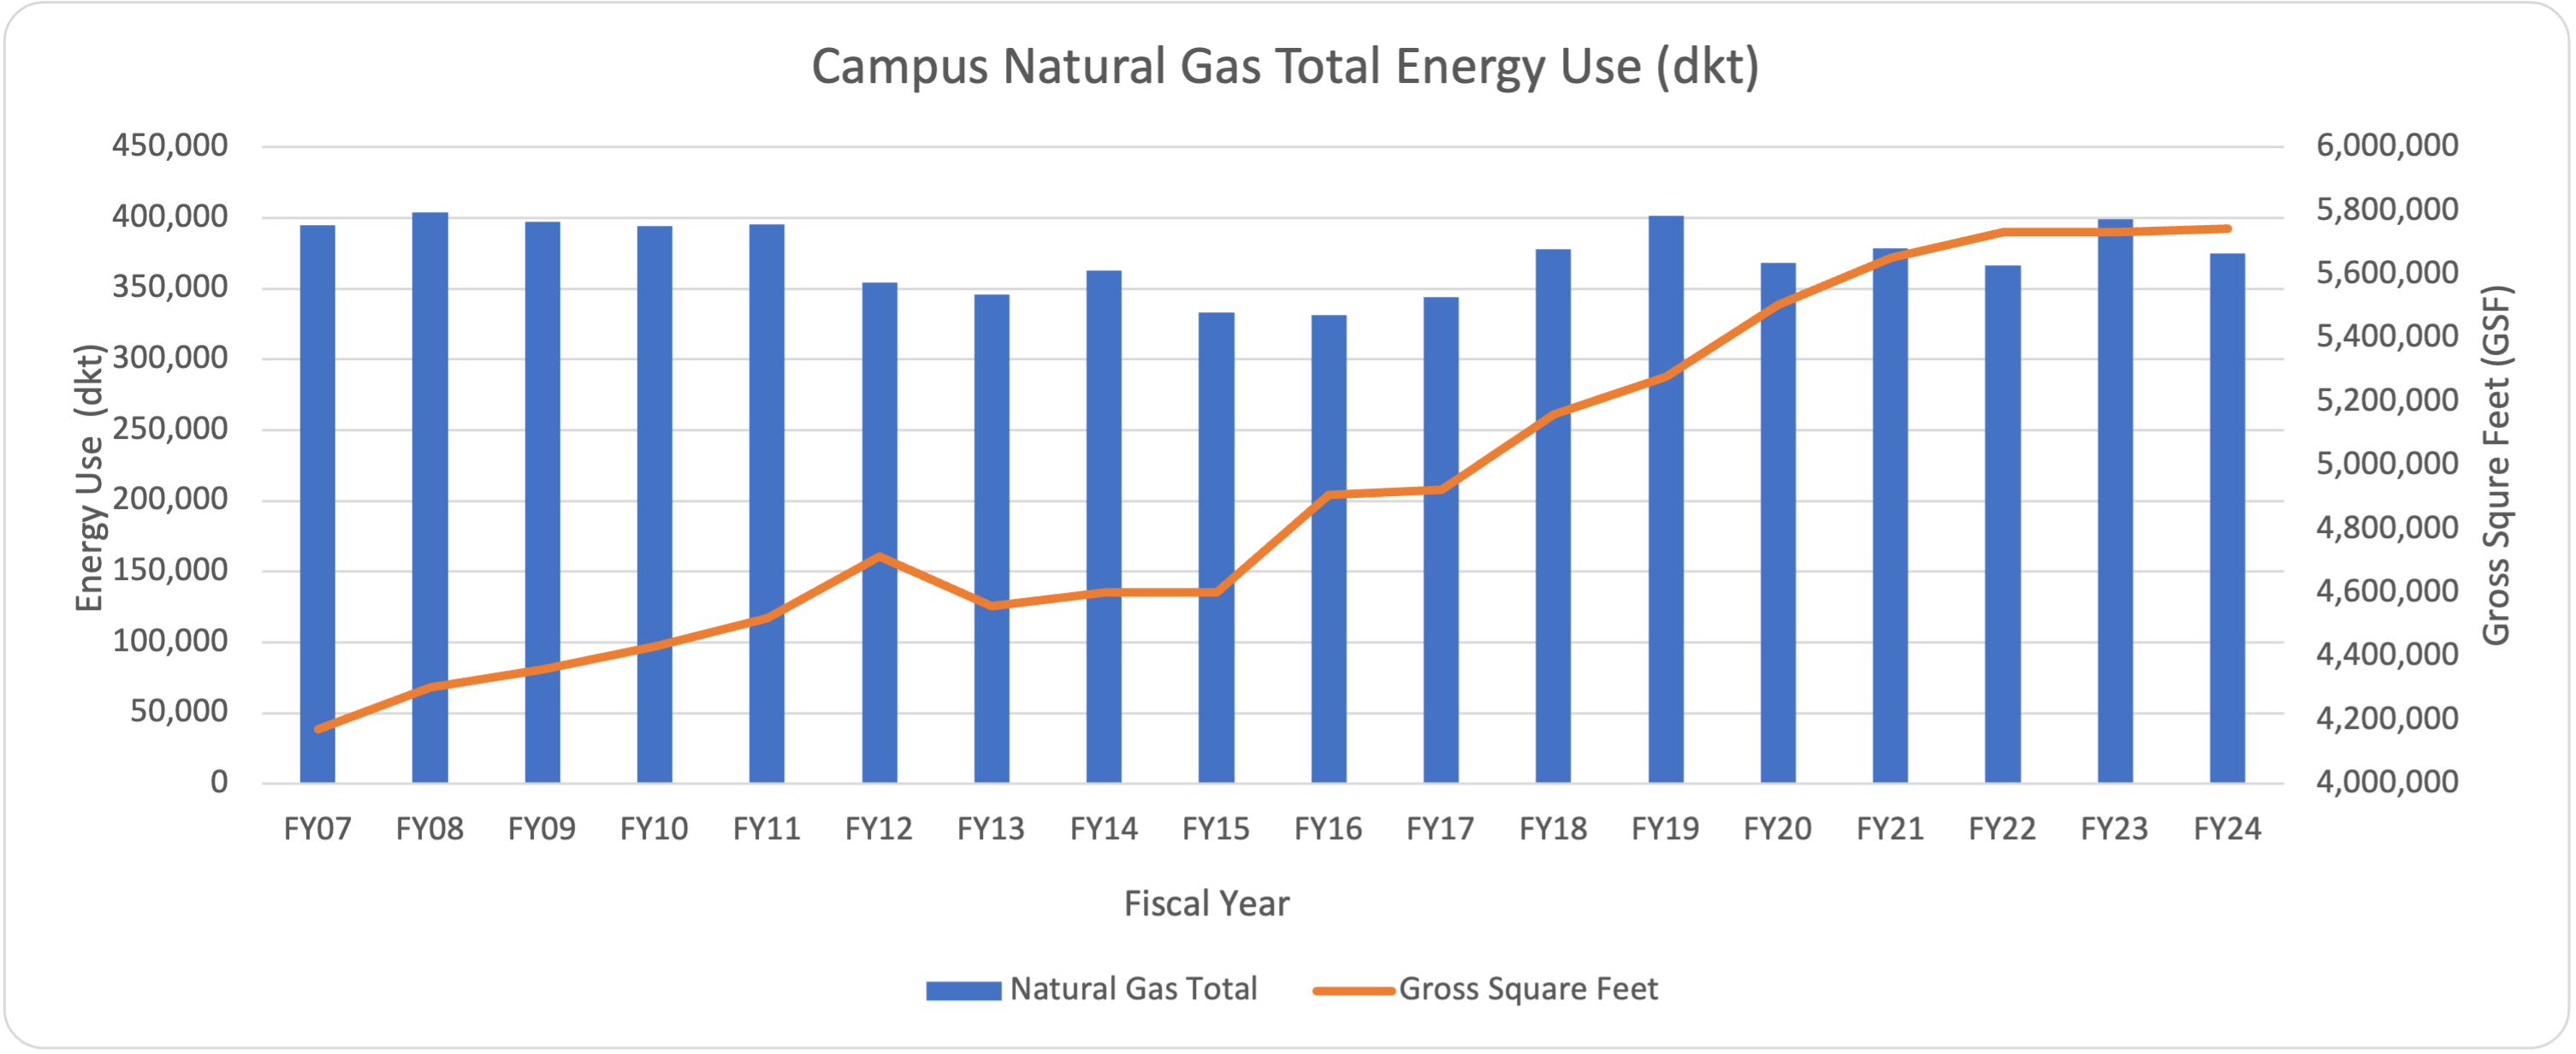
Campus natural gas use has decreased 5% since FY07. Campus gross square feet has increased 38% over the same period. Natural gas use per gross square foot has decreased 31%.
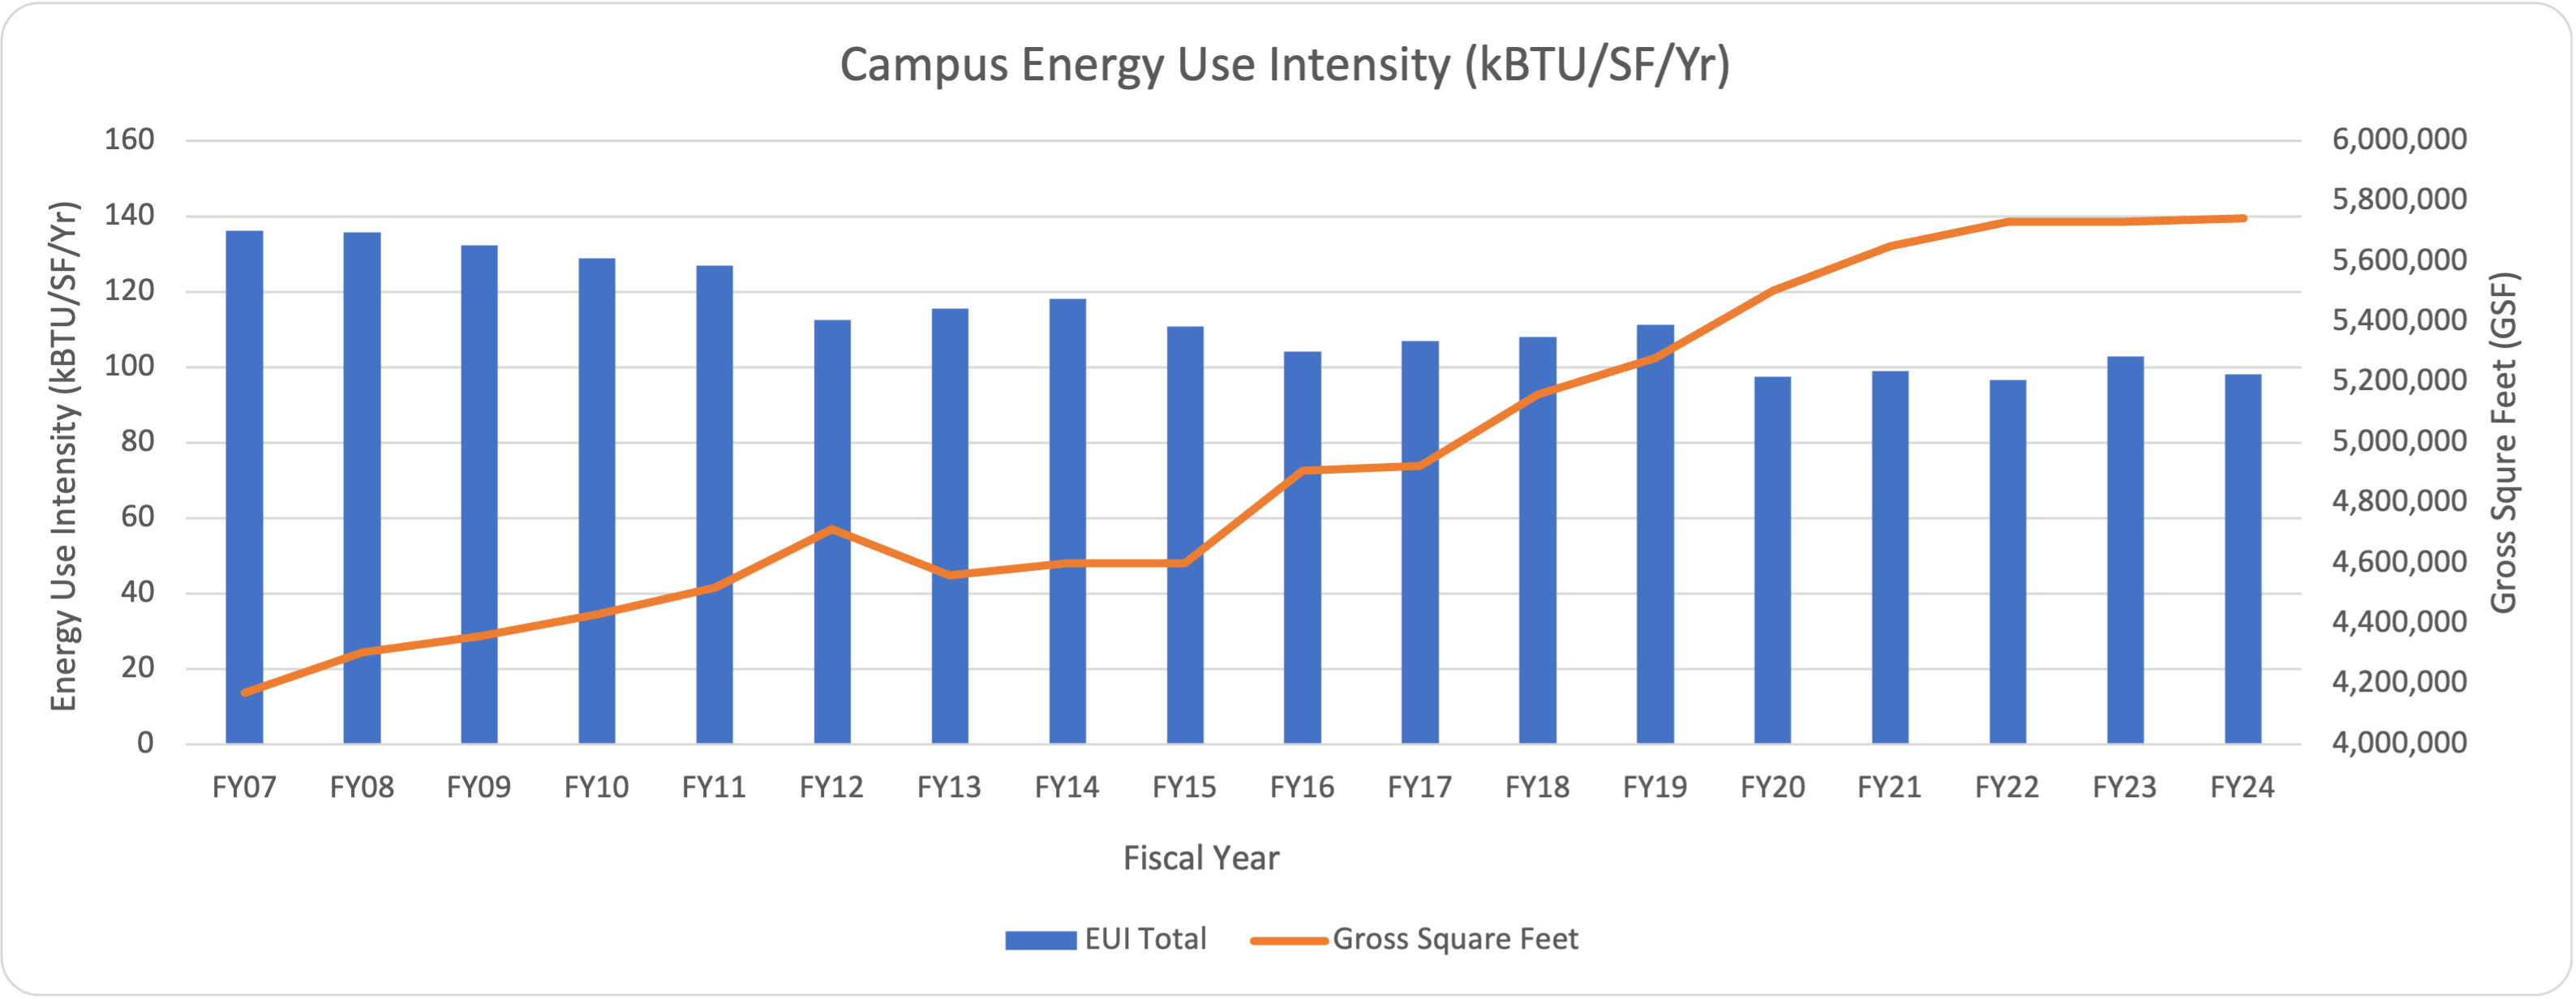
Campus energy use intensity decreased 28% since FY07. Campus gross square feet has increased 38% over the same period.